- Jul 18, 2020
The surprising data about costs
- Rose Thun
The surprising data about costs
If you had to guess how much costs vary across the US, on average, what would you expect?
They vary far less than you’d imagine.
If you look at averages across all 382 places, the variances are within 3% difference for almost everything. Real estate, taxes and insurance vary more. But each of those has wide range of options and choices you can make to make anyplace workable.
Of course, you can find extremes beyond these averages. Out of sight luxury apartments for millions and couch surfing arrangements for very little but the averages across the country are remarkably consistent.
While money can’t buy happiness, it does give more freedom. While any absolute number is a temporary snapshot, taken in 2019, the relative % of income per category of cost on average, as well as the minimum and maximum nationwide is summarized below and is useful.
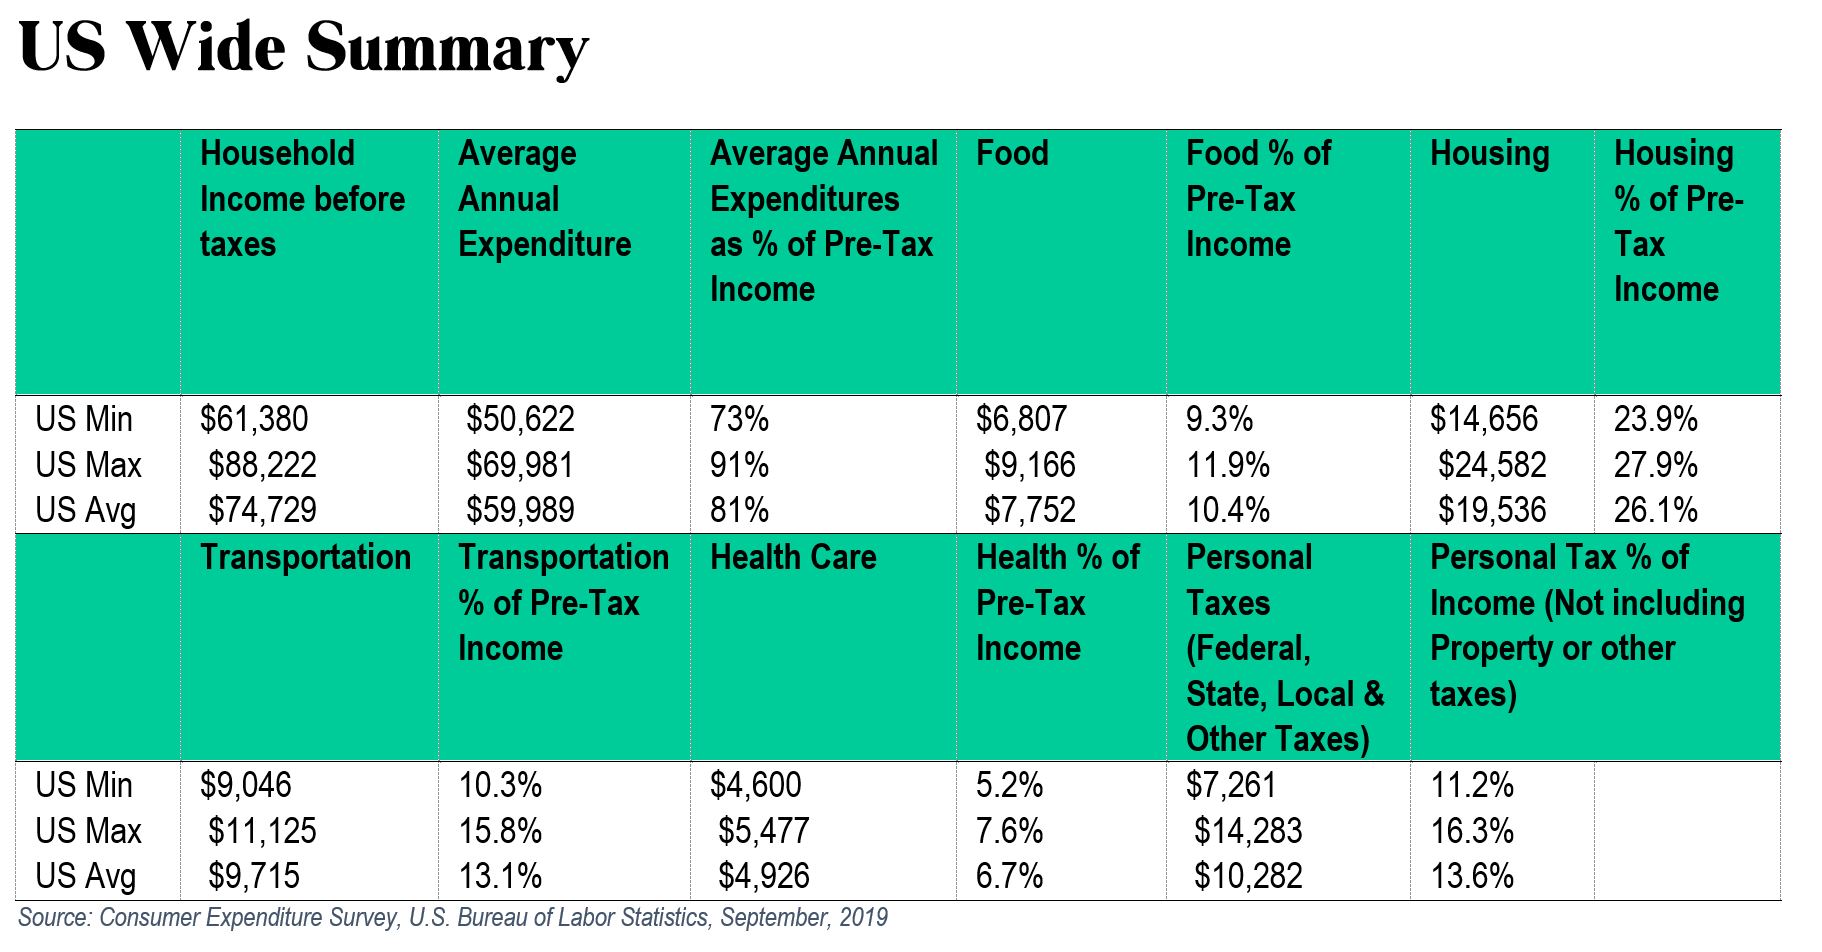
Food, Healthcare, Transportation -Vary Relatively Little
It is interesting to note in the Table above how relatively little health care and food vary across the country (~3% / $3k or less from US Min to US Max). Transportation, Taxes and Housing are ~5% difference.
Insurance
While the Selection Tool and Place Reports do not include insurance data (beyond the Consumer Expenditure Survey, U.S. Bureau of Labor Statistics, September, 2019 costs), because it is proprietary data, frequently changing, and is based on credit ratings, storm and flood risks, and other very localized and personal data. This is a topic you should get expert estimates for when comparing locations. Per insurance.com for example, Average Renters Insurance Can Vary 7X! depending on which state you live in. https://www.insurance.com/home-and-renters-insurance/coverage/renters-insurance-guide.html and you can even be denied coverage if you live in a high risk area. There are many tools and experts to determine your rates https://www.insurance.com/home-and-renters-insurance/home-insurance-basics/5-factors-that-affect-rates.html and more on from the insurance industry on www.iii.org
I also find it helpful to prioritize in thinking about money. Some of my favorite tools:
Tim Ferriss’ lifestyle calculator to encourage doing mini-retirements at a younger age (I’ve loved when I do this- I think of them more as downshifting and simplifying).
Ramit Sethi’s money dials where you consciously spend extravagantly on the highest priority thing that excites you, and frugally on everything else.
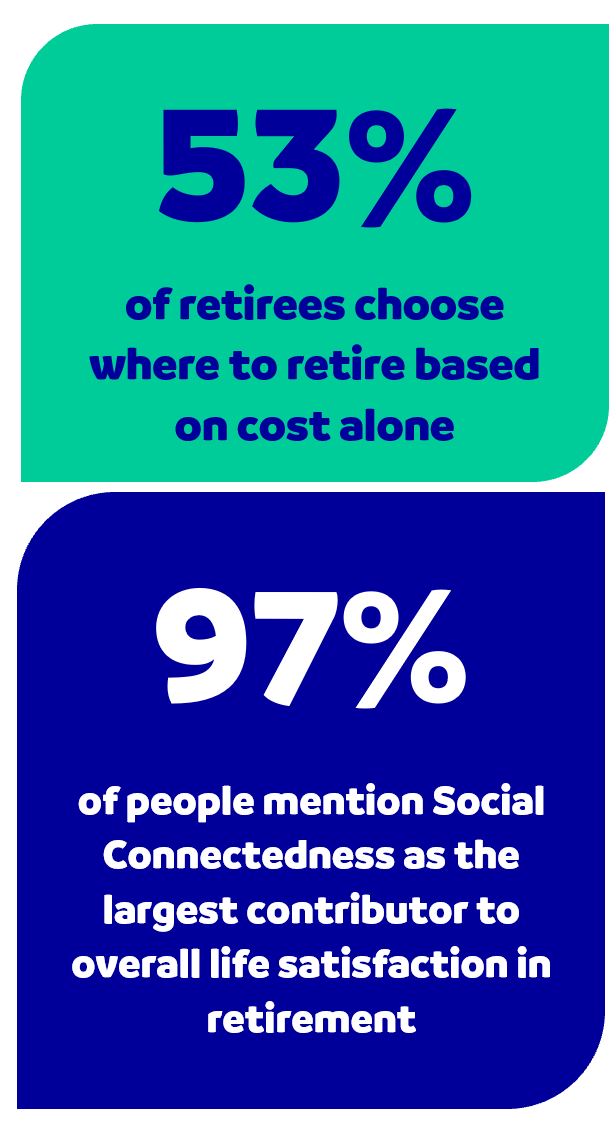
I’ve written to you before about the Transamerica Center for Retirement Studies data, which says 53% of retirees choose where to retire based on cost alone and the Stanford Center on Longevity’s work, which shows that 97% of people mention Social Connectedness as the largest contributor to overall life satisfaction in retirement- far ahead of finances, material status and even physical health.
The data may surprise you!
What makes you feel social connected-ness is unique to you and is what makes up your priorities- They’re your happiness dials. And it suggests you can make most places work, if you do the right trade-offs on housing, taxes and insurance. All the rest varies rather little.

Photo by Agê Barros on Unsplash
If you have any questions, or feedback, please send me a note at Hello @ ChooseMYHappyPlace.com
Best wishes,
Rose Thun, CEO and Creator of the Choose MY Happy Place Method©
www.ChooseMYHappyPlace.com
PS- What about cost changes with COVID? That post is next. Stay Thun-ed
PPS -If you'd like to see a sample Top 10 report from the Selection Tool, or a sample Place Report, with over 600 attributes for one location, take a look here at the new Try before you buy page https://www.choosemyhappyplace.com/try-before-you-buy