- Aug 24, 2020
Comparing Climate Risks Across the US
- Rose Thun
As Hurricanes Marco and Laura head in this week, wild fires ravage CA, and so many unusual weather events continue this year, I send best wishes to everyone in the path of the storms and fires. And I am curious to compare the storm and climate risk data across the US since the intensity and frequency has definitely increased in recent years.
For today, I’ve assembled more data her than one should put in an email or blog post! Hope it will be helpful. These are just 19 of the 600+ types of data included in the Place Reports.
The summary:
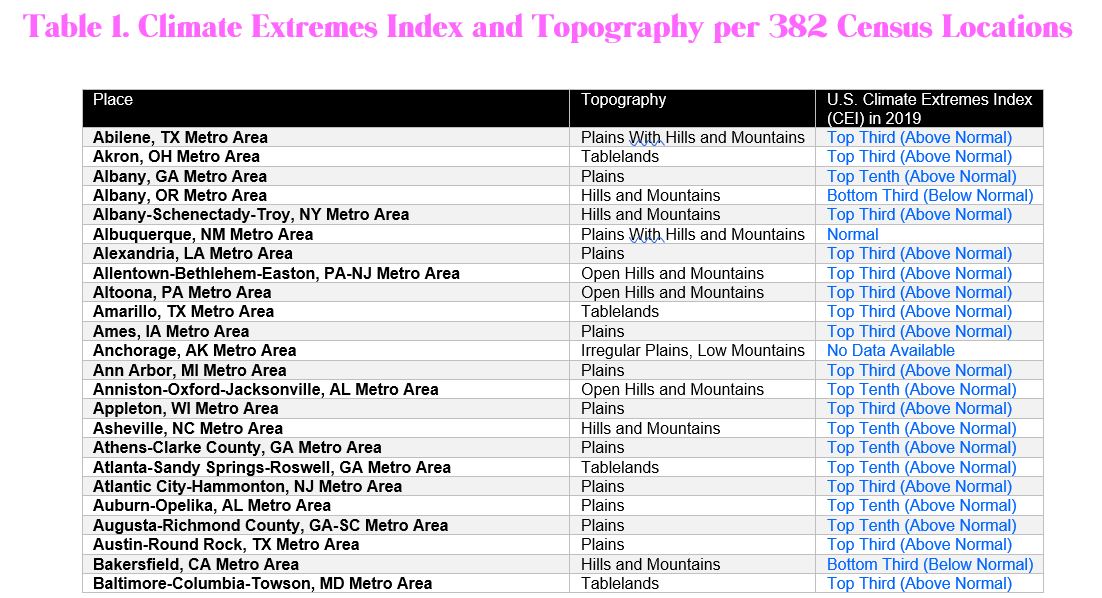
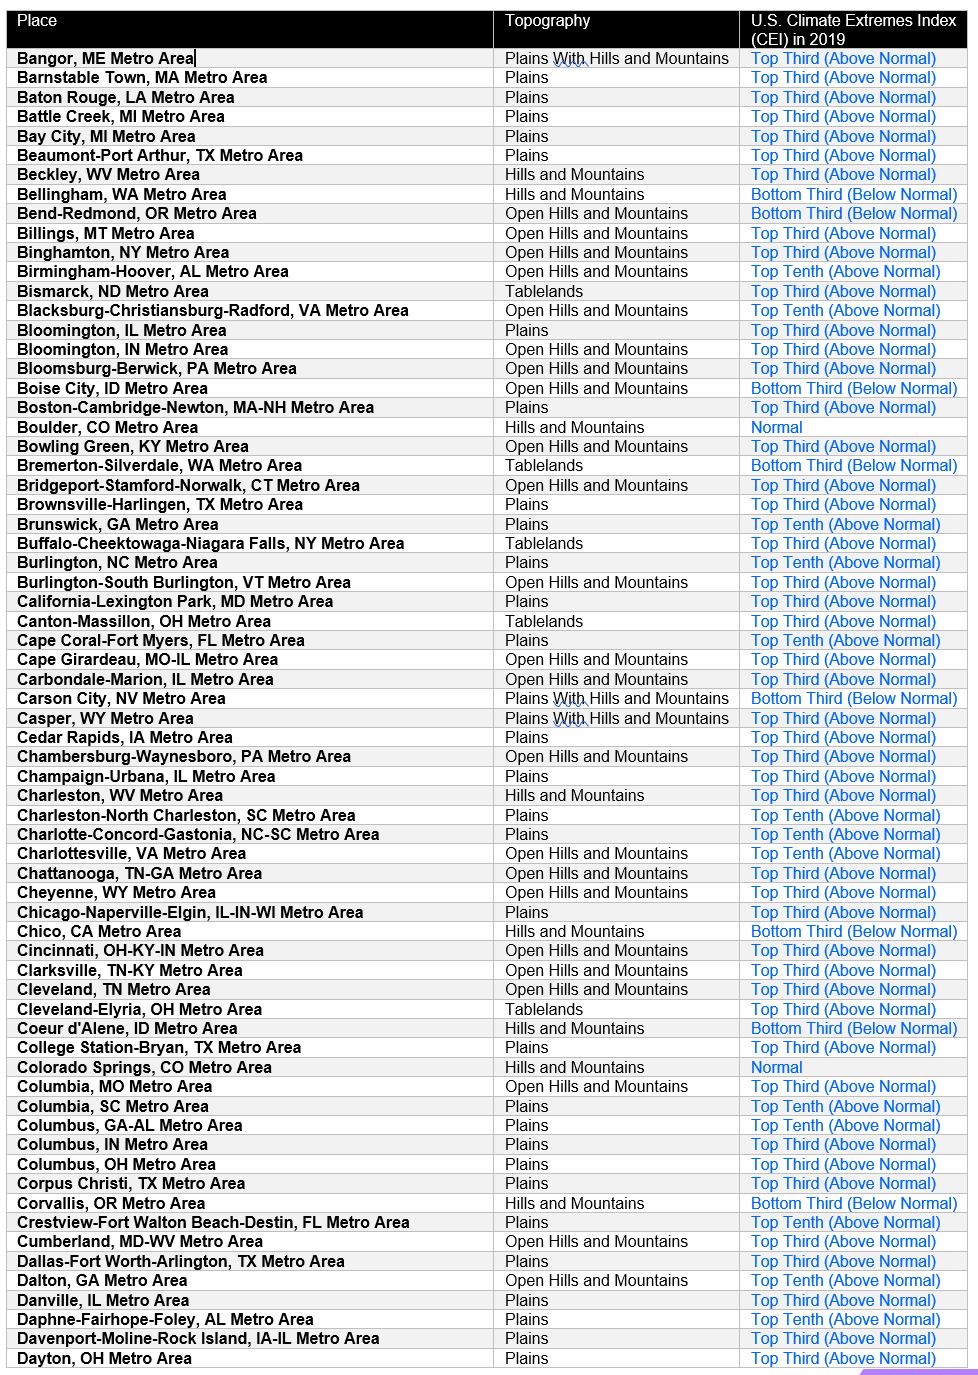
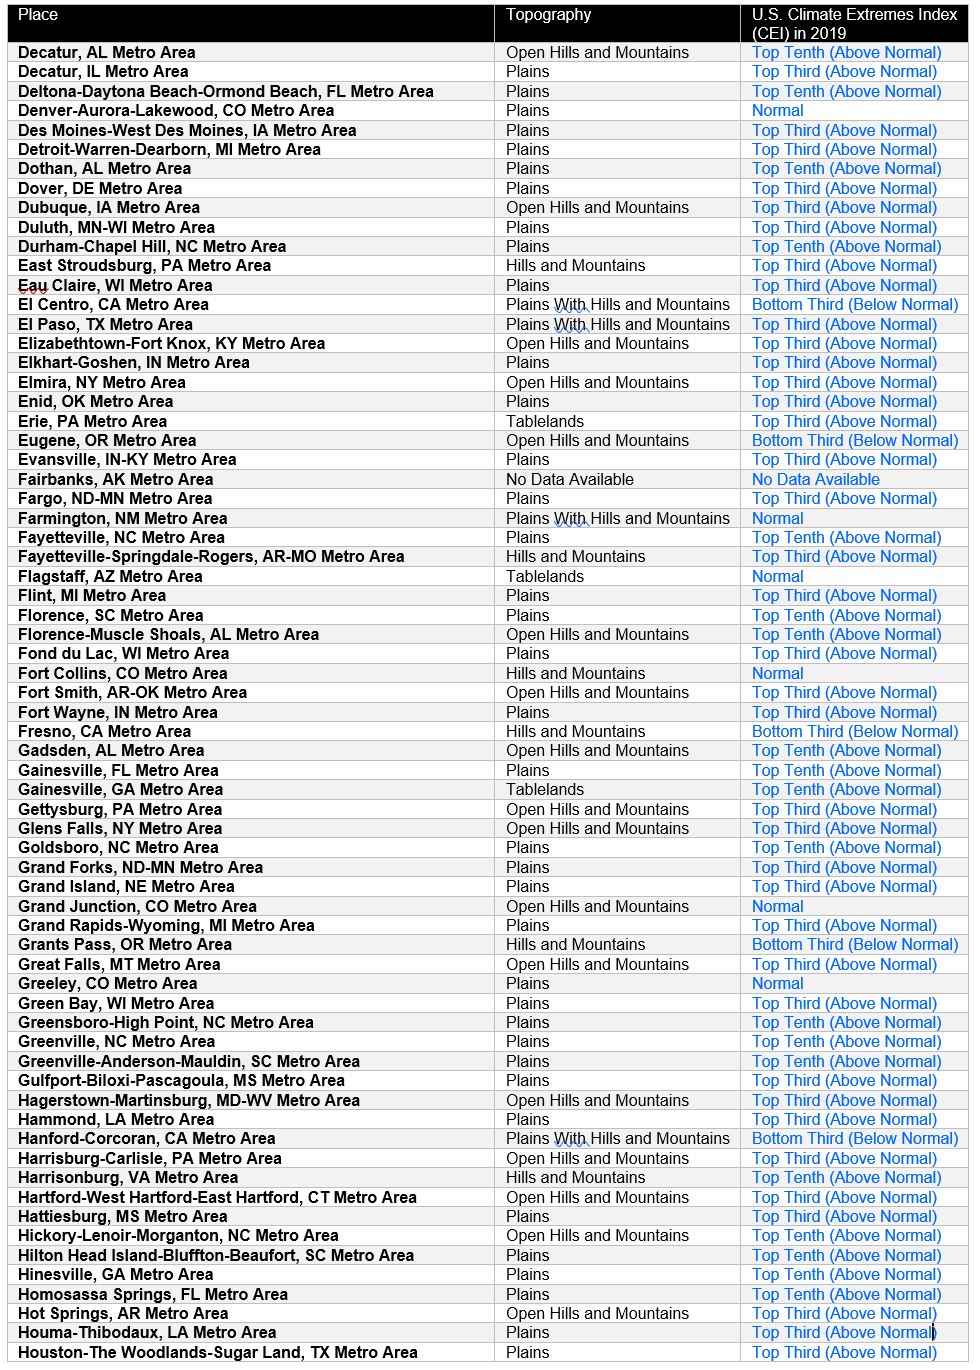
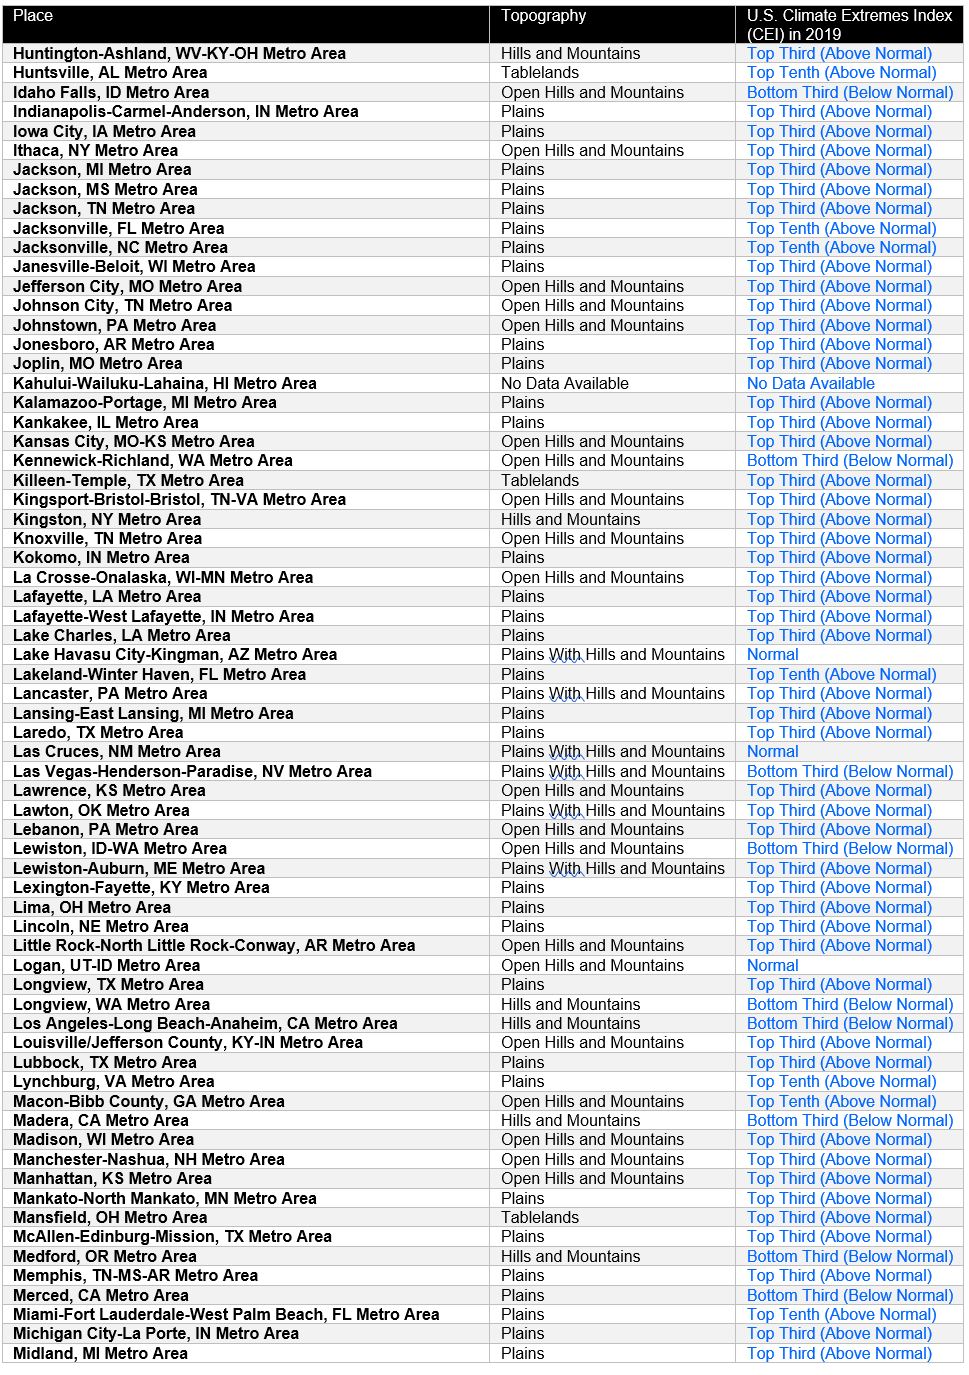
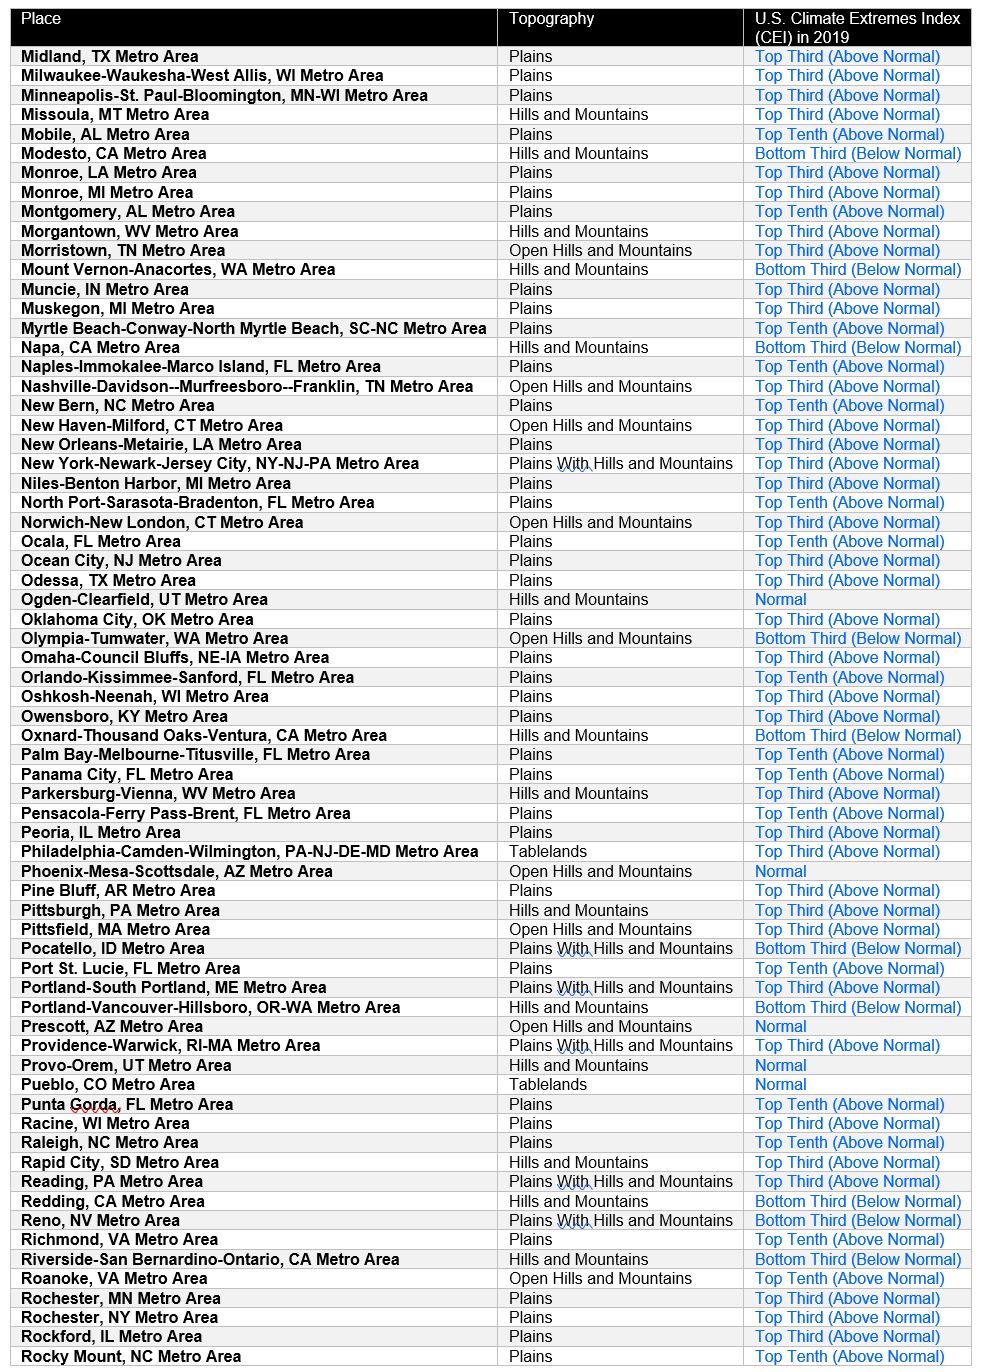
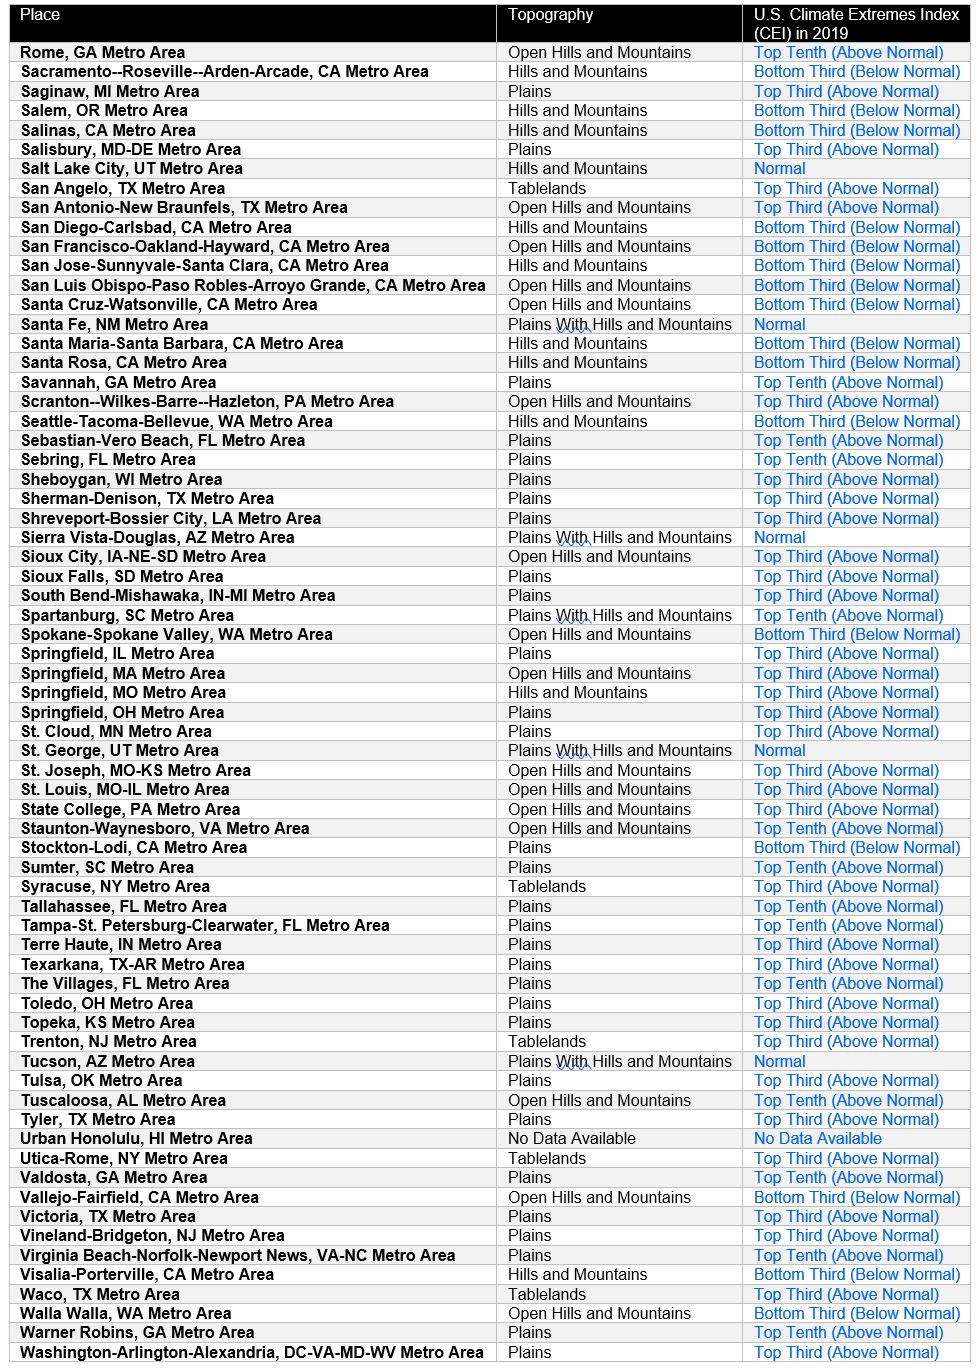
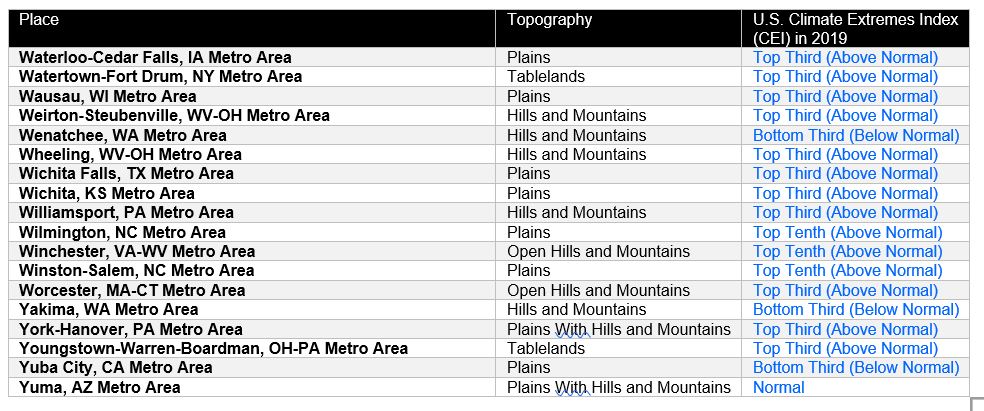
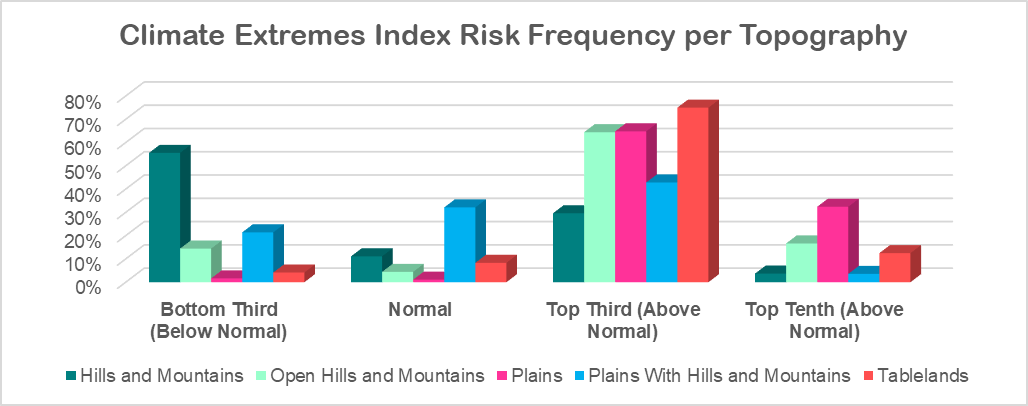
1. Topography of hills and mountains seems to provide reduced climate extremes risk historically.
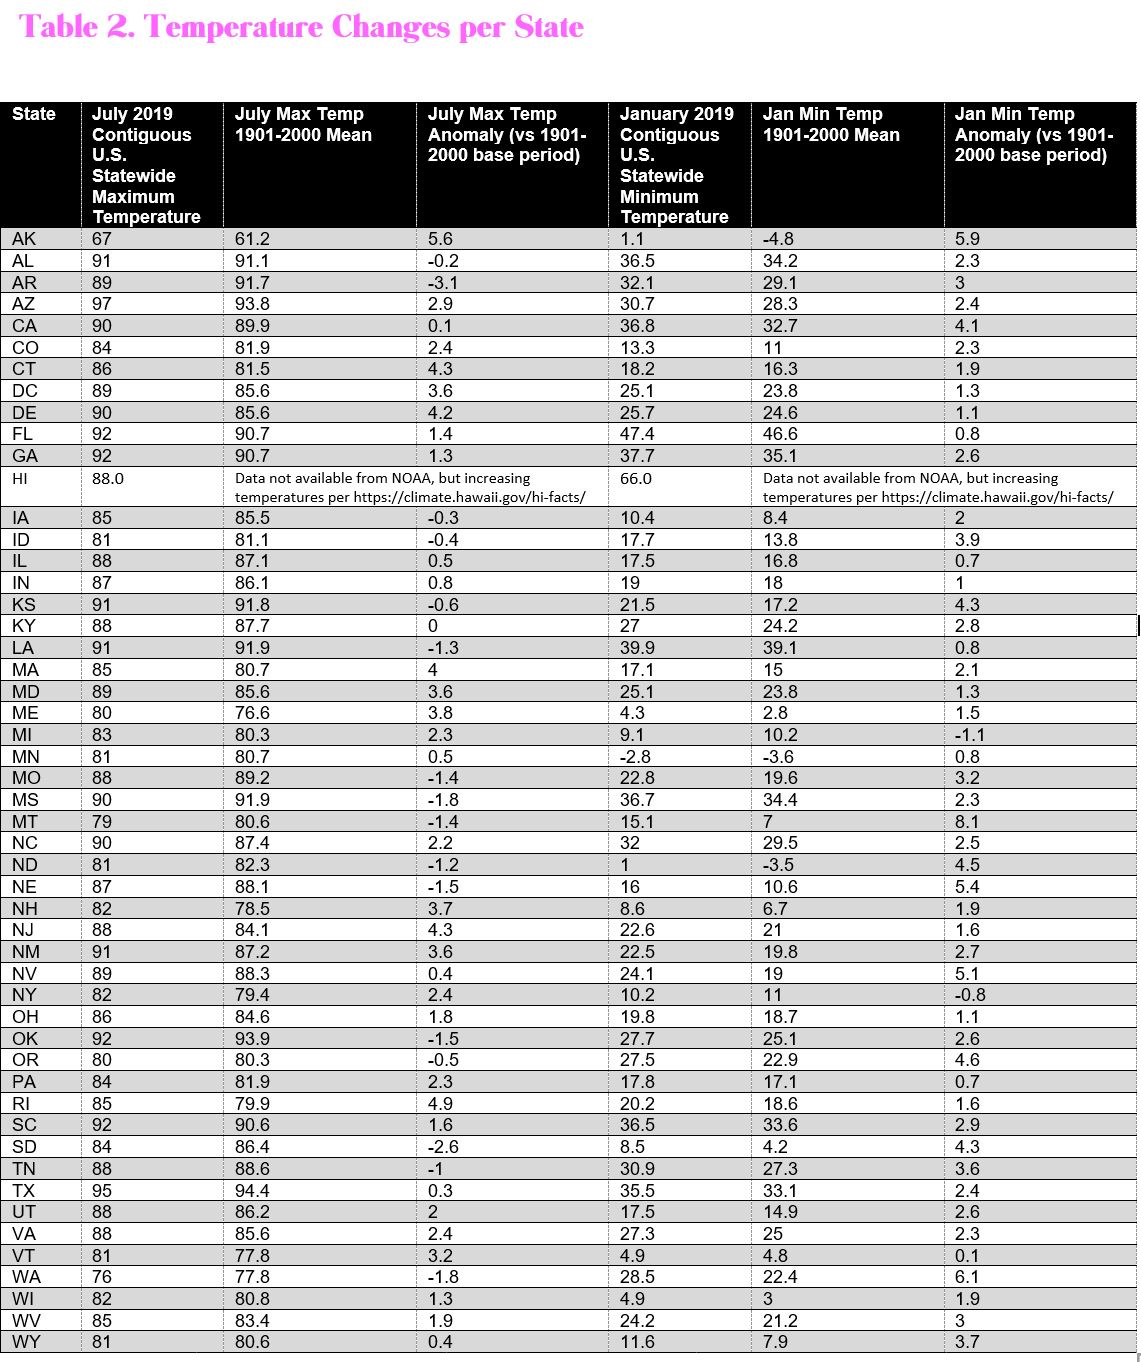
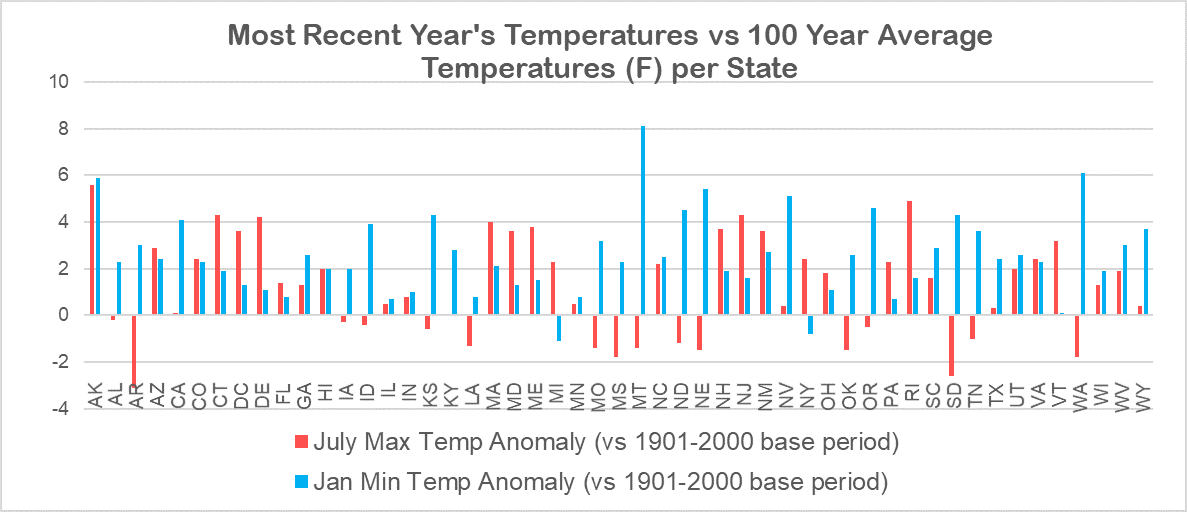
2. Temperatures are rising in most States
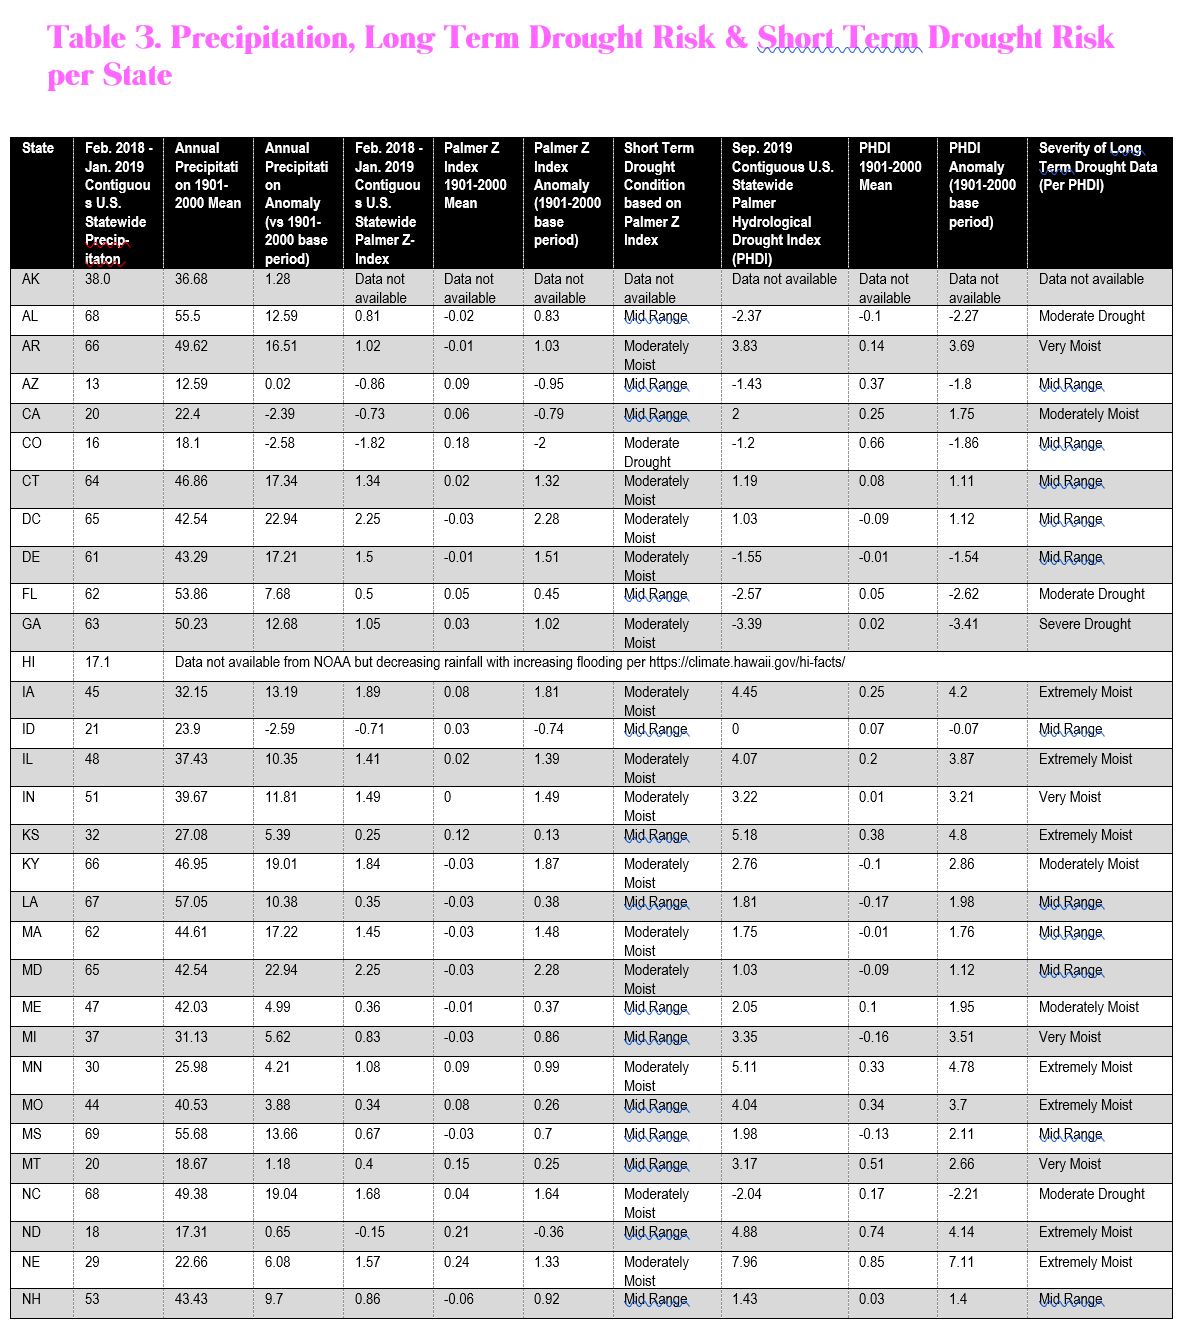
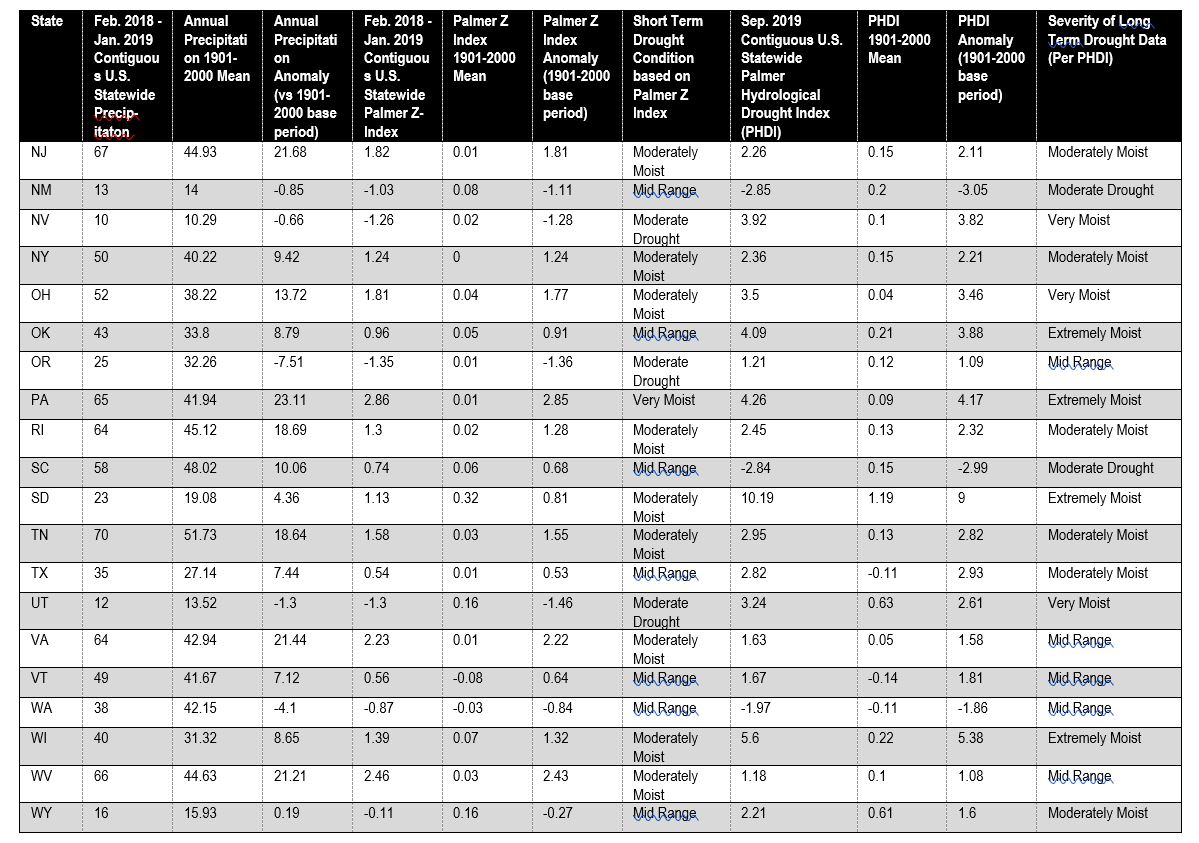
3. Precipitation and Drought Risk are changing in most States (There is no Palmer Z or PHDI data for AK or HI).
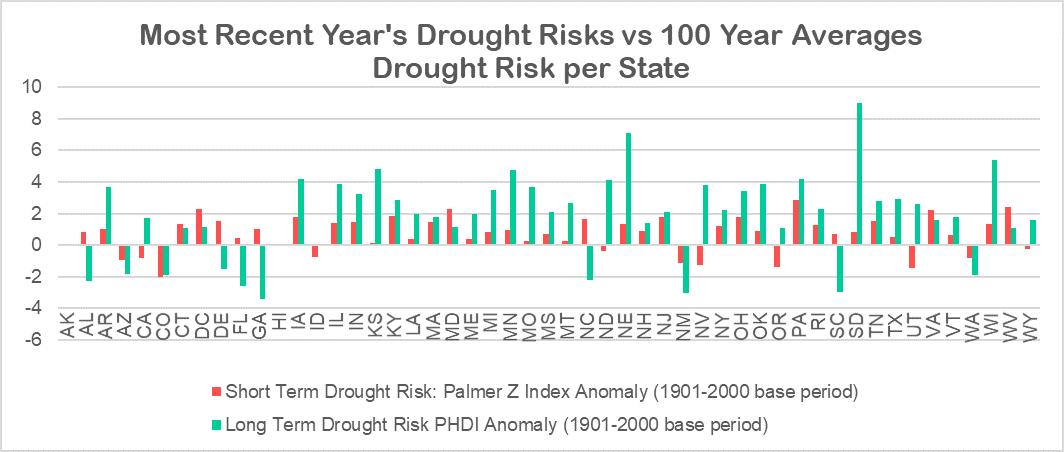
The full details are in the three tables on below this text and include:
Table 1. Climate Extremes Index and Topography per Census Locations
Table 2. Temperature Changes per State
Table 3. Precipitation, Long Term Drought Risk & Short Term Drought Risk per State
If you think this is helpful, and you’d like the full climate report with rising sea levels, asthma rates, and additional data You can buy the full report here https://www.choosemyhappyplace.com/climate-report
Keep exploring and get to your happy place sooner.
Best wishes,
Rose Thun
Notes about this data:
Data from the National Oceanic and Atmospheric Administration (NOAA) National Centers for Environmental US Climate Extremes Index (CEI) retrieved on February 18, 2020 and rechecked August 23, 2020 https://www.ncdc.noaa.gov/extremes/cei/regional-overview/2019/01-12/cei-hi NOAA describes its CEI as “This index charts the occurrence of specific extreme events over time since 1910. In most cases, extreme events are defined as lying in the outermost (“most unusual”) ten percent of a place’s history.”
Topography data comes from The National Atlas of the United States of America U.S. Department of Interior, U.S. Geological Survey, Washington, DC., 1970 reported at each of the 382 Census locations.
Data from the National Oceanic and Atmospheric Administration (NOAA) National Centers for Environmental information, Climate at a Glance: Statewide Mapping, published October 2019, retrieved on October 12, 2019, February 18, 2020 and August 23, 2020 from https://www.ncdc.noaa.gov/cag/
HI is not included in the reports on temperature, precipitation or drought risk (Palmer Z and PHDI), so data was gathered from: https://climate.hawaii.gov/hi-facts/ reports that temperature are continuously and dramatically rising since 1950, rainfall is less overall and heavier when it comes leading to increased flooding, and sea level is currently rising an inch every four years. https://www.fws.gov/pacific/climatechange/changepi.html and https://statesummaries.ncics.org/chapter/hi/ support this data with additional detail.
There is no Palmer Z or PHDI drought risk data available for Alaska.